Case Studies / MongoDB
How MongoDB Cut PR Size by ~50% and Improved PR Cycle Time with Optimal AI
Accelerate delivery, reduce costly rework, and improve engineering predictability with instant, full-context reviews and real-time insights across your entire eng org.
Reduction in PR Size
~50%
Smaller, reviewable changes → faster approvals + fewer merge conflicts.
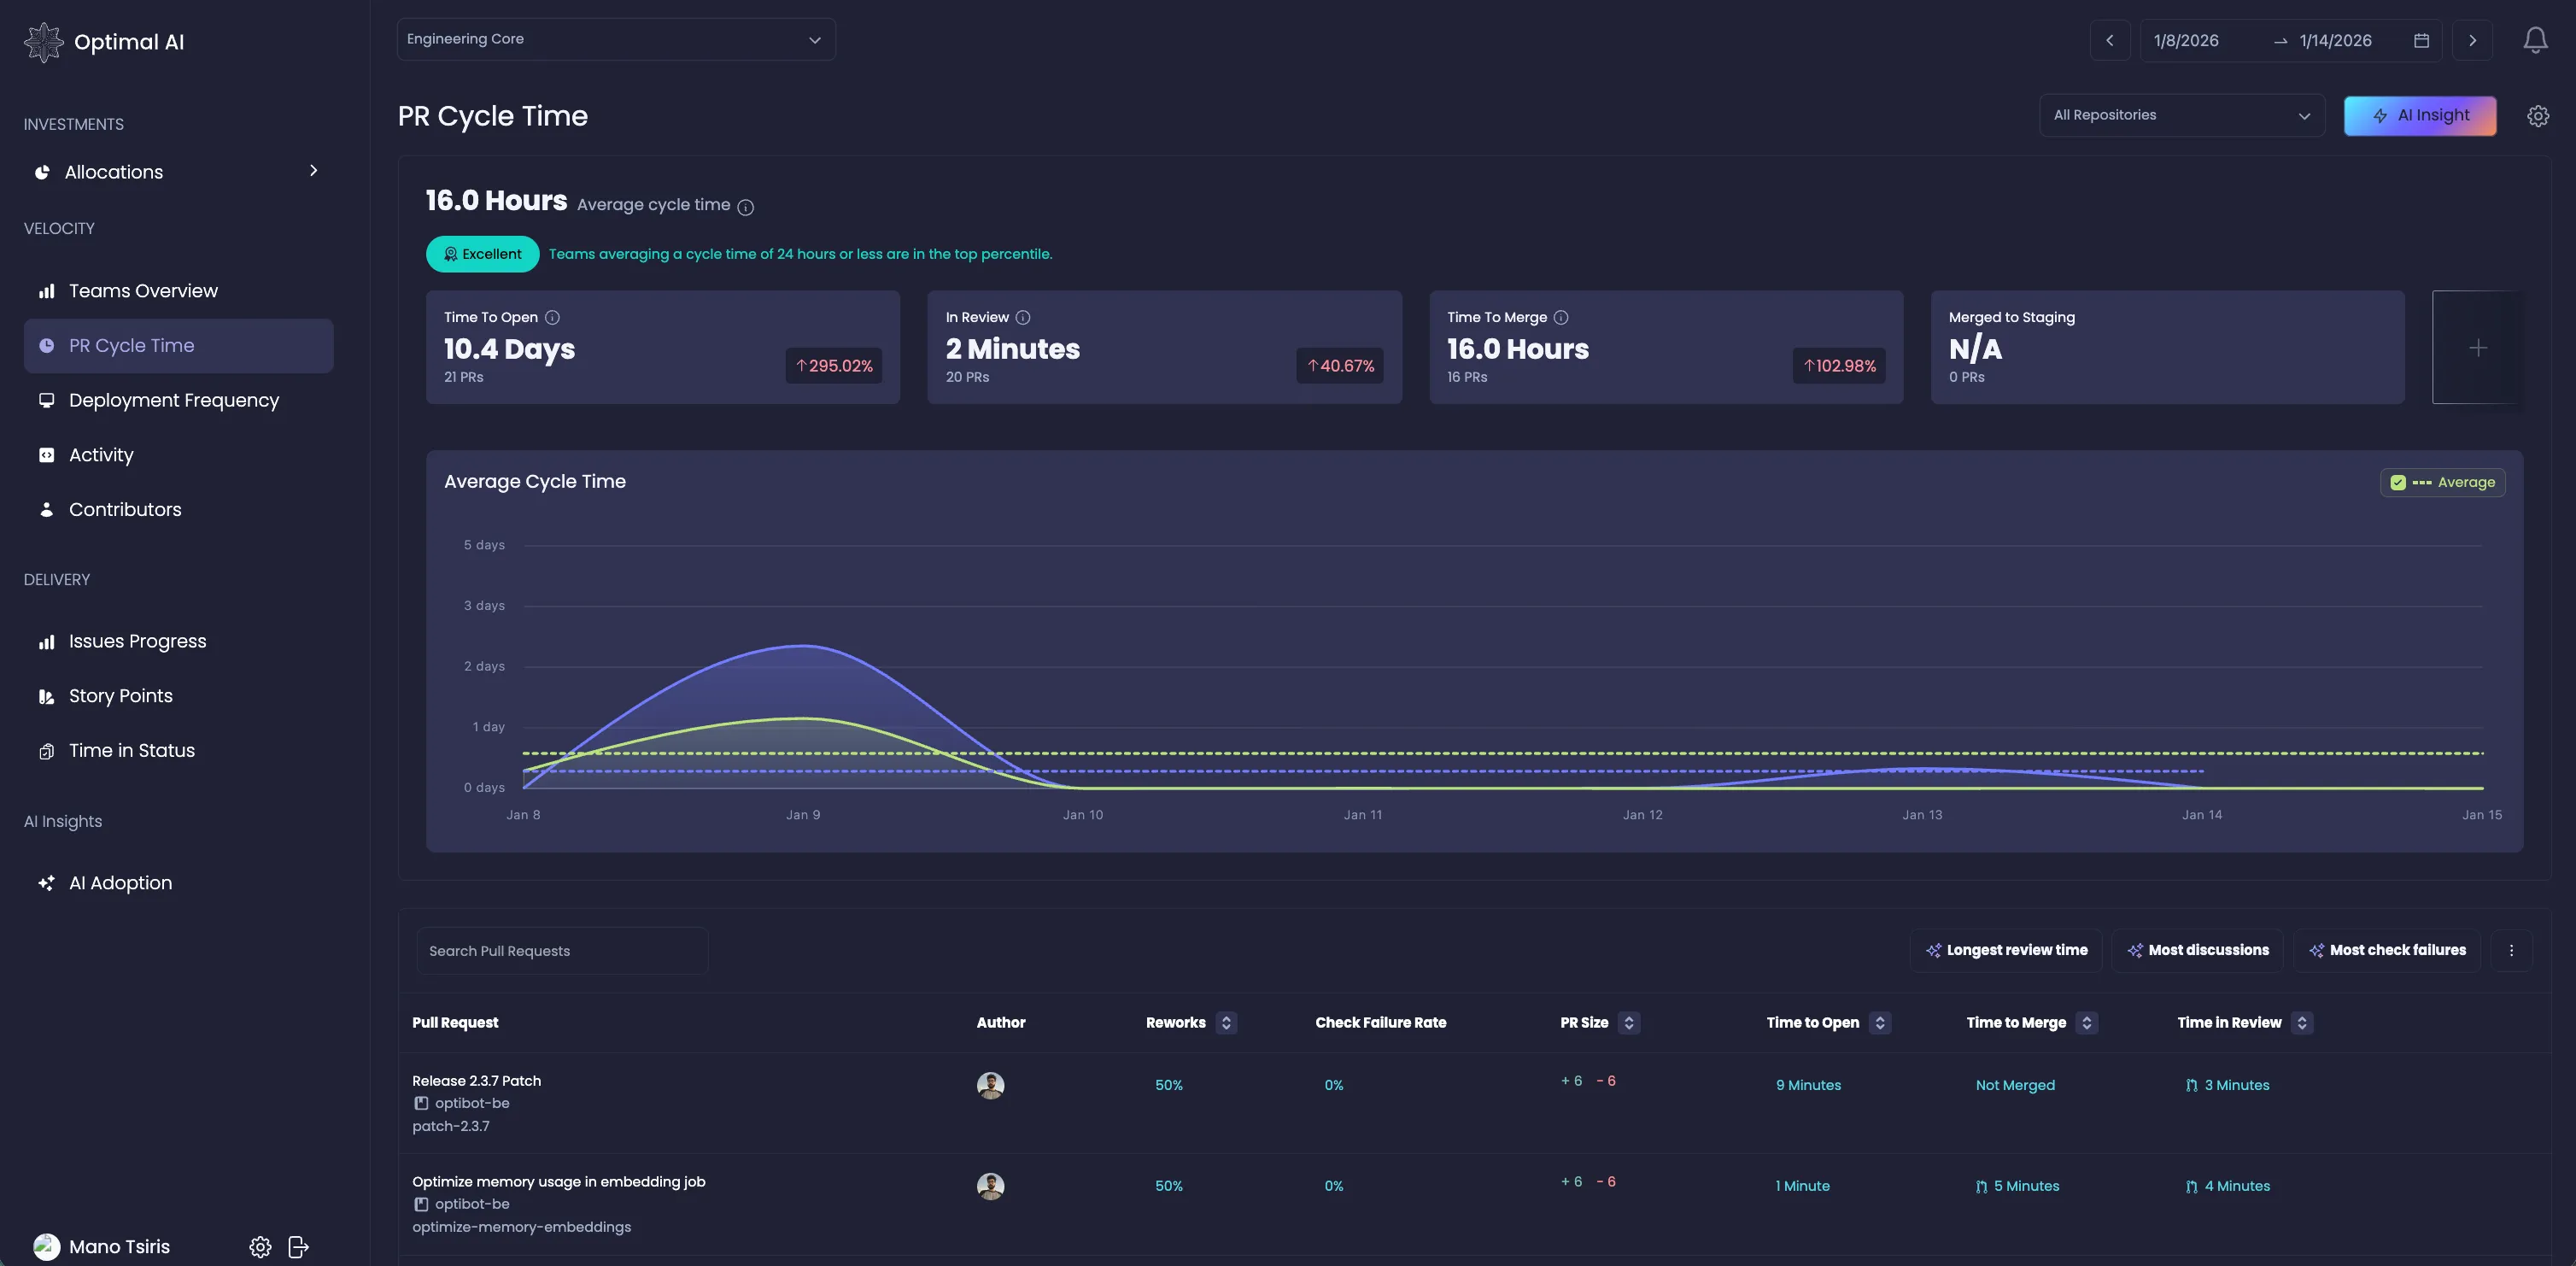
Faster PR Cycle Time
~30%
Clear visibility into root causes → quicker unblocking.
Centralized Engineering Visibility
100%
From Jira to GitHub → one place for metrics teams trust.
Reduction in PR Size
~50%
Smaller, reviewable changes → faster approvals + fewer merge conflicts.
Faster PR Cycle Time
~30%
Clear visibility into root causes → quicker unblocking.
Centralized Engineering Visibility
100%
From Jira to GitHub → one place for metrics teams trust.
See why engineering leaders at high growth companies use Optimal AI

"Optimal AI cut our PR review time nearly in half. Our team finally has visibility into what's slowing us down"
Lila Brooks
Software Engineering Manager, MongoDB
Ad-hoc scripts, spreadsheet gymnastics, and limited adoption
Before Insights, visibility depended on manual effort across teams:
- Custom scripts maintained by different departments to extract data
- CSV/Excel workflows to transform and aggregate metrics
- Hand-built dashboards that required constant updates
"We were using scripts folks had written, dumping data into Excel, then producing higher-level dashboards… it was never easy to use."
Lila Brooks
Engineering Manager, MongoDB
The friction showed up everywhere: metrics were slow to produce, hard to trust, and inconsistent across org levels. Adoption lagged because switching views, filtering by teams/people/activities, and answering simple questions took too much effort.
Without a single source of truth, it was difficult to:
- See where time was going (tech debt vs. bugs vs. discovery vs. feature work)
- Understand where PRs were getting stuck and why cycle time was high
- Spot patterns and unblock issues before they affected delivery
A single source of truth with Investments, Jira integration, and smooth UX
MongoDB adopted Optimal AI Insights to replace scripts and spreadsheets with a single, navigable system for engineering metrics.
Unified dashboards
One place to see all metrics, with fast filters by team, person, and activity.
Investments view
Clear allocation across technical debt, bug fixes, discovery, feature development, and more—by week, sprint, or quarter.
Jira integration
Real-time view of effort by epics/initiatives, where work got blocked, and why—fueling root-cause discussions.
Adoption-ready UX
Smooth switching between views and filters → better usage from engineers to directors and above—no code, no scripts.
"We now have a single place to see all the metrics. We can filter by teams, people, activities—without writing or maintaining code. The UX is smooth, so adoption improved from engineers up to directors."
Lila Brooks
Engineering Manager, MongoDB
With shared visibility, leaders and ICs could pinpoint large PRs, see who/why, and run the right conversations to create quick wins—like reducing PR size and improving deployment frequency.
PRs ~50% smaller, faster cycle time, and organization-wide adoption
The move to Insights produced noticeable, measurable improvements:
- PR size reduced by nearly 50%
- Improved PR cycle time, driven by clarity on where/why reviews were slow
- Higher PR quality, supported by focused conversations on large PRs
- Improved deployment frequency, enabled by smaller, easier-to-review changes
- Widespread adoption across levels (engineers → senior engineers → directors+)
"We were able to get the size of our PRs much smaller—nearly 50%—and improve our PR cycle time by understanding why review was taking time."
Lila Brooks
Engineering Manager, MongoDB
"Investments shows where the team's effort is spent. Seeing tech debt, bug fixes, discovery, and features—by sprint or quarter—helps us focus."
Lila Brooks
Engineering Manager, MongoDB
The Impact in Numbers
Before and after metrics for MongoDB's Internal Tools team using Optimal AI Insights
From scripts and spreadsheets to a single, adoption-ready source of truth — with measurable delivery improvements.
Metric
Before Insights
After Insights
Improvement
PR Size
Large, inconsistent, hard to review
Right-sized, easier to review
PR Cycle Time
Slow on large PRs; unclear drivers
Root-cause visibility; faster reviews
Engineering Metrics Access
Custom scripts + CSV/Excel + manual dashboards
Single system; fast filters by team/person/activity
Investment Visibility
Fragmented view of effort
Investments by tech debt, bugs, discovery, features
Jira Integration
Manual rollups; limited blockage insight
Effort by epic/initiative; blocked-work detection
Adoption & UX
Low adoption; hard to switch views
Engineers → Directors use shared dashboards
Deployment Frequency
Held back by large PRs
Smaller PRs enable faster releases

Cut cycle time by 50% and get visibility into engineering productivity
Start reviewing PRs faster, catching issues earlier, and shipping with confidence.